Investigating power control in a voltage source converter
Introduction
The output from solar PV cells and battery cells is DC. As such, a DC-AC converter is required to connect a solar PV array or a BESS to the AC grid, and the term 'converter fed generator' is commonly used.
Engineering Recommendation G99[1] sets the requirements for generation systems connected in parallel with public distribution networks. One requirement, leaving aside the specific dimensions, requires generating systems of >1MW to be able to generate and absorb reactive power, while generating active power. For converter fed generators, this will be a function of the converter.
A converter in a battery energy storage system (BESS) must be able to operate bidirectionally: as an inverter when supplying the grid and a rectifier when charging the batteries.
When modelling renewable energy generators in electrical power systems, using analysis software such as PowerFactory, a predesigned component for a converter is used. The low level workings of converters are hidden from the electrical power engineer.
In this report, the capabilities of converters are reviewed. The formulae for calculating power output from a voltage source converter (VSC) are presented. A VSC is constructed at the power electronics component level using an electric circuit simulator, ECSP.[2] The model is configured in accordance with the theory to deliver the core power flow requirements for G99 and a BESS. The power output is analysed to see if this has been achieved.
This is not an exercise in power electronics or VSC design. The model constructed in the simulator is a 'bare bones' converter, with the criteria only to demonstrate power flow direction in line with the power output theory, with a similar power magnitude. It is not an appraisal of ECSP, which is not used by E4B Consult for commercial work. It is an exercise to investigate the theory and low level workings of a converter.
Converters
Converters can be one of two main types: current source converters (CSC) and voltage source converters (VSC). CSCs have been in commercial use since the 1950s and the technology is well established. Reactive power cannot be controlled, and reverse power flow can only be achieved by reversing the polarity of the DC power supply.[3] CSCs are not considered in this report. VSCs are a newer but fast developing technology. Both active and reactive power can be controlled, and they can convert from DC to AC (termed an inverter) and from AC to DC (termed a rectifier). The focus of this report is on VSCs.
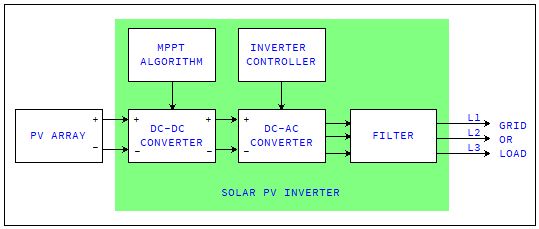
Figure 1 – Block diagram showing the major components of an inverter in a solar PV system.
A commercial solar PV inverter has at least the components shown in Figure 1. MPPT and DC-DC conversion are outside of the scope of this report. The DC-AC converter is the component of interest.
Voltage source converters
VSCs are constructed from insulated-gate bipolar transistors (IGBTs) which can be turned on and off by a gate signal. The polarity of the DC voltage is fixed and is considered to be constant (hence the term ‘voltage source’).[4]
Topology
The topology can be two-level, three-level or multi-level.[5] Two-level topology is regarded as having poor harmonic performance, which necessitates large filters for grid connection. This can be mitigated with a three-level topology, and multi-level VSCs have advantages for use in high voltage systems. However, the gate signals for three-level and multi-level are much more complex to generate than for two-level.
Single or three phase AC output
VSCs can produce single phase or three phase AC from the DC source. The general arrangement for a single phase VSC is shown in Figure 2 (left). Gate signals switch the IGBTs S1 and S2, S3 and S4, on and off in turn. When S1 and S2 are on, S3 and S4 will be off, and there will be a positive load voltage Vc (i.e. Vc > 0). When S3 and S4 are on, S1 and S2 will be off, and there will be a negative load voltage Vc (i.e. Vc < 0). The voltage, Vc, on the inverter’s AC output terminals alternates between +Vdc and -Vdc.
Figure 2 (right) shows the general arrangement of a three phase, two-level VSC. The operation is similar to that for the single phase VSC described above, but the gate signals applied to the three pairs of IGBTs will each have a 120° phase shift. The phase to ground voltage will alternate between +Vdc/2 and -Vdc/2.
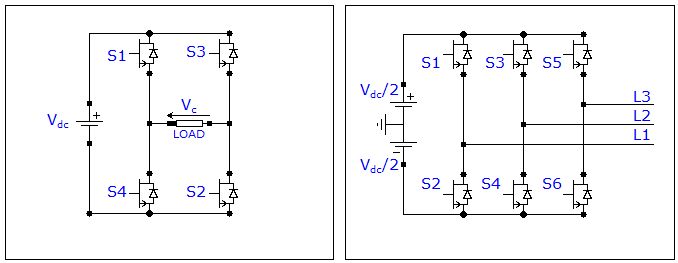
Figure 2 – Single phase (left) and three phase (right), two-level, VSC.
Modulation
The gate signal for the IGBTs is generated using the pulse width modulation (PWM) technique.[5] The output from the PWM device is generated from two signals: a sine wave known as the reference signal, and a triangular wave known as the carrier signal.[6] The signals are shown diagrammatically in Figure 3. Comparing the reference signal with the carrier signal governs the pulse width. With further reference to Figure 2, when:
Reference signal > carrier signal, S1 and S2 are on, PWM = 1
Reference signal < carrier signal, S1 and S2 are off, PWM = 0.
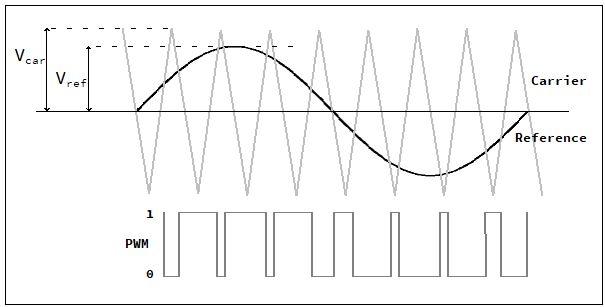
Figure 3 – PWM gate signal for IGBTs, generated from Carrier and Reference signals.
The ratio of the magnitudes of the reference and carrier signals is the Amplitude Modulation Index Ma, as shown in Equation (1). For example, in Figure 3, Ma ≅ 0.8

Equation (1) - Amplitude Modulation Index Ma.
The frequency of the reference signal determines the frequency of the AC output from the VSC:
VSC AC frequency = reference signal frequency.
Active and reactive power control
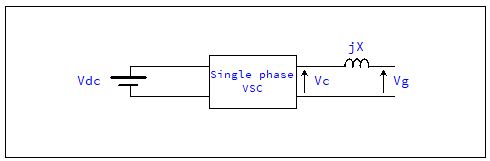
Figure 4 – Single phase VSC with the parameters for power control.
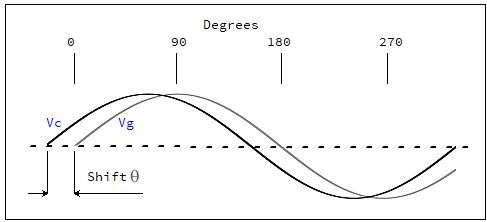
Figure 5 – VSC and grid phase shift θ.
The AC output voltage from the VSC is Vc. The RMS value for single phase and three phase systems is given by Equation (2) and Equation (3) respectively.

Equation (2) – RMS value of AC output voltage Vc from a single phase VSC.

Equation (3) – RMS value of AC output voltage Vc from a three phase VSC.
The active and reactive powers are calculated by Equation (4) and Equation (5) respectively, where: X is the impedance of the grid, in Ohms; θ is the phase shift between Vc and Vg, in degrees.

Equation (4) – Active power P (W) for a VSC.[5]

Equation (5) – Reactive power Q (VA) for a VSC.[5]
From equations (4) and (5), P and Q can be positive (power is being generated or exported) or negative (power is being absorbed or imported). The conditions are:
θ = 0 ⇒ P = 0 (Condition A)
θ > 0 ⇒ P > 0 (Condition B)
θ < 0 ⇒ P < 0 (Condition C)
Vc = (Vg.cos θ) ⇒ Q = 0 (Condition D)
Vc > (Vg.cos θ) ⇒ Q > 0 (Condition E)
Vc < (Vg.cos θ) ⇒ Q < 0 (Condition F)
Summary of VSC power control
- Output voltage magnitude Vc can be controlled by Ma.
- Output voltage frequency can be controlled by the frequency of the reference signal Vref.
- Active power P and reactive power Q can be controlled Vc and the phase shift θ between Vc and Vgrid.
Procedure
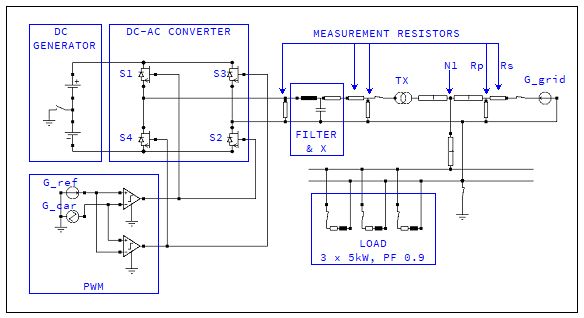
Figure 6 – Schematic of the model, developed in ECSP.
A single phase, two-level VSC was constructed using ECSP. A schematic of the model is shown in Figure 6. With reference to Figure 1, the model built has only the DC-AC converter and a filter. The output from the DC generator, modelled with batteries, is fixed at 400 Vdc. With reference to Equation (4) and (5), X is fixed at 2.24Ω. The system has three loads, each 5kW at 0.9 PF. The grid generator, G_grid, provides the balance of power to the load. It is fixed at 230V RMS.
G_car and G_ref are used to create PWM gate signals for the four IGBTs S1-S4. G_car generates the triangular carrier wave, fixed at 100V peak, 1350Hz. G_ref generates the sinusoidal reference signal at a fixed frequency of 50Hz. Its magnitude, Vref in Figure 3 and Equation (1), and phase angle, θ, are varied to create three configurations of the model, which are introduced and described in Table 1.
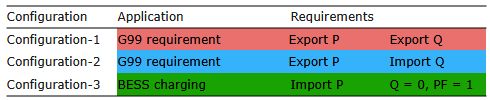
Table 1 – Model configurations.
The settings for each configuration are shown in Table 2. Calculated values of P and Q (the expected results) for each configuration are included in Table 3.
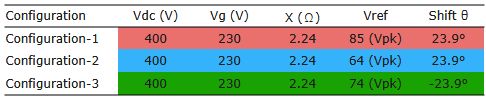
Table 2 – Parameters for each model configuration.
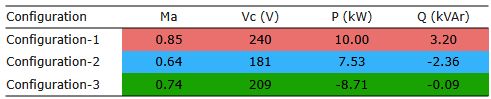
Table 3 – Calculated values for Ma, Vc, P and Q, using Equations (1), (3), (4) and (5) respectively.
Components in the model can be set to output results for voltage, current or power, which are plotted in the time domain (phasor domain output is not available due to some of the components used in the model). The series resistor, Rs, is very small and used to measure G_grid current. The parallel resistor, Rp, is very large and used to measure voltage. For each configuration, the relative phase angle between current through Rs and voltage across Rp was recorded (that is, I lagging or leading V). Power output from G_grid was plotted in the time domain.
The output from ECSP is 'functional' rather than 'pretty'. For this report, the output plots were screen grabbed and edited in a paint program with colour for presentation.
Power curve analysis
By convention, power flowing from a generator is -ve. Power flowing into a node is +ve, and -ve if flowing out of a node. At node N1 on the schematic, the algebraic sum of P, Q and Load powers must be zero:
VSC power + Grid power - Load power = 0
VSC power = Load power - Grid power (Equation 6)
Load power is known, grid power is measured, therefore VSC power can be calculated using the power flow equation (Equation 6).
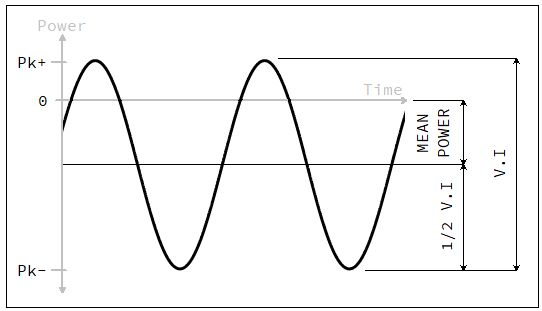
Figure 7 – An AC power curve. Frequency will be twice the supply frequency.
With reference to Figure 7, the power plots from G-Grid can be analysed using the following time domain equations:
1/2.V.I = Apparent power S = 1/2 x (Pk+ - Pk-) (kVA) (Equation 7)
Mean power = Active power P = Pk+ - S (kW) (Equation 8)
Reactive power Q = ± √(S2 – P2) (kVAr) (Equation 9)
If current in Rs lags the voltage across Rp, G-grid must be exporting reactive power, and Q at N1 is +ve.
Results, calculations and discussion
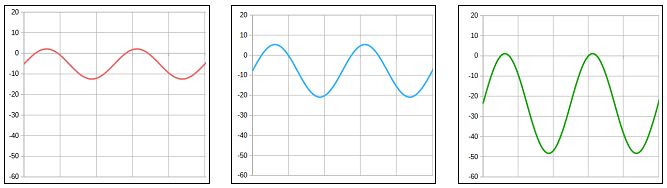
Figure 8 – G_grid power. Time domain plots: Configuration-1 (l), Configuration-2 (c), Configuration-3 (r). Y-axis is in kVA.
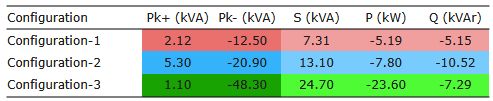
Table 4 – G_grid power. Time domain plot dimensions, with calculations for S, P and Q using equations above.
The power output from G_grid for each configuration is shown as time domain plots in Figure 8. Table 4 is an analysis of the plots, using the time domain analysis equations (Equations 7, 8 & 9). Current in Rs lags the voltage in all configurations, therefore, Q is being exported by G_grid. P and Q are -ve by convention as the power is flowing out of the generator.
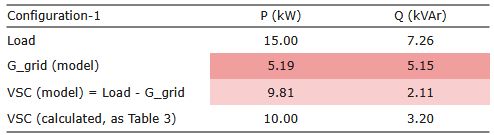
Table 5 – Tabulated results for Configuration-1.
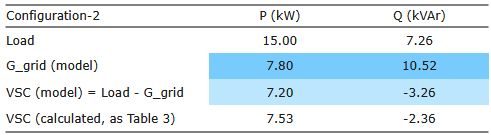
Table 6 – Tabulated results for Configuration-2.
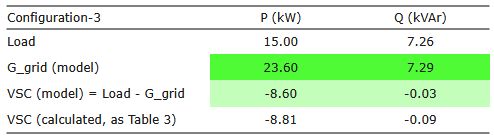
Table 7 – Tabulated results for Configuration-3.
Tables 5, 6 and 7 show the VSC power at node N1, calculated from the power flow equation (Equation 6). For comparison, the bottom line of shows the theoretical VSC power.
Table 1 lists the requirement for Configuration-1 as the VSC exporting both active and reactive power. Tables 2 & 3 show θ > 0 leading to P > 0 (Condition B), and Vc > (Vg.cos θ) leading to Q > 0 (Condition E). With θ = 23.9° and Vc = 240V RMS, Table 5 shows that the VSC was generating 9.81 kW of active power and 2.11 kVAr of reactive power.
Table 1 lists the requirement for Configuration-2 as the VSC exporting active power and importing reactive power. Tables 2 & 3 show θ > 0 leading to P > 0 (Condition B), and Vc < (Vg.cos θ) leading to Q < 0 (Condition F). With θ = 23.9° and Vc = 181V RMS, Table 6 shows that the VSC was generating 7.20 kW of active power and importing 3.26 kVAr of reactive power.
Table 1 lists the requirement for Configuration-3 as the VSC importing active power, with zero reactive power. Tables 2 & 3 show θ < 0 leading to P < 0 (Condition C), and Vc ≅ (Vg.cos θ) leading to Q ≅ 0 (Condition D). With θ = -23.9° and Vc = 209V RMS, Table 7 shows that the VSC was importing 8.60 kW of active power and, at -0.03 kVAr, reactive power was approximately zero.
For all three configurations, power flow direction is as predicted by the theory. Modelled active power magnitudes are similar to the calculated values. For reactive powers, the magnitudes are of a similar order to those calculated, but the percentage errors are large, which can be expected due to the simplistic design of the power electronics.
Conclusions
Converters in grid connected solar PV systems greater than 1MW are required by the G99 Regulations to both generate and absorb reactive power while generating active power. In BESS systems, it is necessary for power to flow bidirectionally through the converter. In a VSC, adjusting the magnitude and phase shift of the control signal Vref will control the magnitude and direction of active and reactive powers in a converter fed generator.
References
[1] Energy Networks Association. Engineering Recommendation G99. Issue 2, 10 March 2025.
[2] ECSP. Online Electric Circuit Simulation Program by Georg Schett. Available at: https://www.ecsp.ch/ [Accessed 16.08.26]
[3] National Grid. High Voltage Direct Current Electricity – technical information. Reference: CRFS09/08/13 Available at: https://www.nationalgrid.com
[4] HVDC Converter. Available at: https://en.wikipedia.org/wiki/HVDC_converter [Accessed 16.08.26]
[5] Adeuyi, O., Liang, J. Integration of power from offshore wind turbines into onshore grids. Cardiff University. Ch14.4
[6] PWM Generator. Mathworks. Available at: https://uk.mathworks.com
Contact
Enquiries are welcome from M&E contractors, consultants and renewable energy system developers.
How can we support you with your electrical design tasks?
Contact details here ...
